Creating and Using Charts
|
|
Creating and Using Charts How to Guide, 1.00.01 |
|
|
|
|
Creating and Using Charts How to Guide, 1.00.01 |
Copyright NoticeThis material is copyright protected. No material may be reproduced or transmitted in any form or by any means for any purpose without expressed written consent of VideoRay LLC. Copyright © 2022, VideoRay LLC - The Global Leader in Micro-ROV Technology |
Language Support
|
Table of Contents |
About this DocumentDocument NavigationYou can navigate through the documentation to specific topics using the menu, or step through sequentially using the Next and Previous arrowhead buttons. The Next button will step you from the current topic to the next topic at the same level unless the current topic has a sub-topic. If the current topic has a sub-topic, the Next button will step you into the first sub-topic. The Previous button works similarly, but in reverse sequence. Your current location within the document is shown as a "breadcrumb" trail at the top of each page under the document title. You can click on any level of the breadcrumb hierarchy to go that location. You can also use the following keyboard shortcuts:
Links are shown in brown font. Finding InformationThis document includes a Table of Contents, Glossary / Index and Google search on each page. You must be connected to the Internet in order to be able to use the Google search, and you can select whether to search VideoRay's online document library only (the default) or the Internet. Document ConventionsSeveral symbols are used throughout this documentation to add emphasis and to assist in relocating important information. The following table describes these symbols and their uses.
Document Customization - My_Notes
Beyond this DocumentThere is no substitute for experience and/or training, especially with respect to the real purpose for which you plan to use this equipment. We encourage you to explore options beyond the scope of these materials to expand your knowledge and skills necessary to support your applications. In addition to this documentation, VideoRay offers training and technical support and hosts a general user discussion forum and user image gallery. We also realize that collectively, users of our products spend considerably more time operating our systems than we do ourselves. Users also encounter more diverse operating environments across an extremely broad range of applications. We highly value this vast experience base, and invite and encourage you to share your experiences and suggestions with us. Please feel free to contact us by any of the methods listed below. Quality CommitmentVideoRay strives to design, manufacture, deliver and support the highest quality products and services, including this documentation. We have made every effort to ensure that this documentation is accurate and provides you with the most up-to-date information. If you find any errors in this documentation or have suggestions for improvements, each page contains a "Help us improve this document" feedback link in the left margin (you must be connected to the Internet to use this link).
DisclaimerThis document is deemed accurate at the time of its writing, however it is not a legal contract and the information contained herein should not be construed to represent any form of commitment. This document as well as the associated products and services are subject to change without notice. Alternate FormatsSingle HTML Page Format Portable / Printable Format HTML File Set |
Customize this Documentation - My_NotesMy_Notes are easy to incorporate directly into the pages of this manual. They can be used to clarify content, add additional information, or document your custom settings, operational tactics or procedures. My_Notes are page specific and display at the bottom of the desired page under the "My_Notes" heading. No programming is required - it is as simple as saving a file with your notes. Creating My_NotesMy_Notes can be written in HTML or plain text. HTML allows for more flexible formatting and inclusion of images or links to other web pages. To add a My_Note, create an HTML or text file containing the note and save it in the VideoRay\My_Notes\ folder, which can be found in the computer account user's documents folder (Documents\ for Windows 7, or My Documents\ for Windows XP). The file should be named the same as the page in which you want the note to appear, with a "my_" prefix (without the quotes). For example, if you want a My_Note to appear at the bottom of this page, the name of the file to create is: my_custom_my_notes.html. The name of the page being viewed can be found in the address bar of the browser being used to display this documentation.
Viewing My_NotesWhen you reload the page, your My_Note will appear - there is nothing else to install or configure. A sample My_Note file has been included to display the My_Note below. You can use this file as a model for creating your own My_Notes. Updating My_NotesTo update a My_Note, simply edit and re-save the My_Note file. Removing My_NotesMy_Notes can be removed by deleting or renaming the My_Note file. Sizing My_Notes Display (Optional)The default vertical size for My_Notes is set to 200 pixels, which is used for the sample My_Note below. Due to browser limitations, My-Notes do not size dynamically. This means that a long My_Note may display a scroll bar in order to view the whole My-Note. You can adjust the size to eliminate the need for the scroll bar. To set the size of a My_Note, you need to edit the file named "my_notes_size_table.js" in the My_Notes\ folder (location defined above). The file contains one line for each page of this document using the following format: window.page_name = size_in_pixels; Find the line for the page that includes the My_Note you want to resize and replace the value of size_in_pixels with the desired size in pixels. The page names are listed alphabetically. Example line from the "my_notes_size_table.js" file for this page: window.custom_my_notes = 200;
|
|
|
Creating and Using Charts How to Guide, 1.00.01 |
How to Get HelpHelp for your Creating and Using Charts All Hours Self-Service / Crowd-Source Tools
Global Support
Regional Support
Training
Operational Strategies and Tactics SupportIf you need help understanding how to apply your system to a specific project, contact VideoRay or you local VideoRay dealer. We can provide guidance or help you find a certified consultant. |
Before Contacting SupportPlease make sure to consider the following information before contacting VideoRay's Technical Support to report a problem. The following information should available:
Once you have collected the recommended information, visit the "How to Get Help" page for contact information. In addition, please review VideoRay's Support website for additional information about:
|
|
|
Creating and Using Charts How to Guide, 1.00.01 |
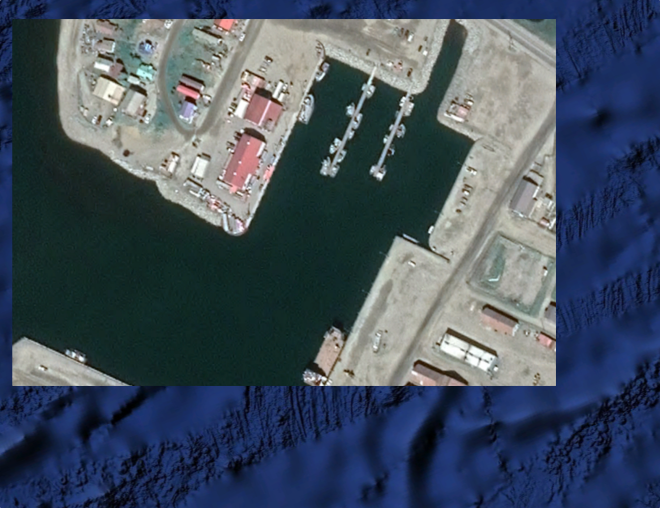
OverviewVideoRay control software and other related applications can use charts to aid in mission planning and navigation. These applications require a geo-referenced file that includes coordinates and scaling information. This document provides information on how to create and use these geo-referenced charts. |
|
|
Creating and Using Charts How to Guide, 1.00.01 |
Creating ChartsSeveral tools are available for creating charts. This document is not intended to be comprehensive list of all possible options.
|
Using SAT2CHART to Create ChartsSAT2CHART works in conjunction with Google Earth, SAS.Planet or OpenCPN to create charts in various formats, including KAP. These charts can be used is various software applications that have mapping and geo-referencing features.
Quick Summary
Reference Information
DownloadsSAT2CHART, Google Earth and SAS.Planet can be downloaded using the following links:
InstallationOnce your files selections have been downloaded, execute each program in the order listed above to complete the installation. Select the default prompts during the installations. Follow the instructions in the Readme.html file for configuring Google Earth to satisfy SAT2CHART's requirements. In general, you can ignore the configuration items indicated as optional. Operation
Creating Charts Using Google Earth
Creating Charts Using SAS.Planet
Your chart can be found in the folder and with the name you specified. This file can be copied to and loaded in your application. See Using Charts. |
|
|
Creating and Using Charts How to Guide, 1.00.01 |
Other Sources of Charts
|
|
|
Creating and Using Charts How to Guide, 1.00.01 |
Using ChartsThis section includes information on how to use charts in the following applications. |
Using Charts in GreenseaAfter creating your chart, copy it to the desired folder on the Operator Control Console.
Procedures
|


