Creating and Using Charts

Creating and Using Charts

How to Guide, 1.00.01

Section 1

Copyright Notice

This material is copyright protected. No material may be reproduced or transmitted in any form or by any means for any purpose without expressed written consent of VideoRay LLC.

Copyright © 2022, VideoRay LLC - The Global Leader in Micro-ROV Technology

Creating and Using Charts

How to Guide, 1.00.01

Section 2

Creating and Using Charts

How to Guide, 1.00.01

Section 3

About this Document

Online Manual

This printed Quick Start Guide is a subset of the full version of this manual, which is available on the Creating and Using Charts
control panel and online in the following formats:

  • Installed on the Creating and Using Charts
    control panel at: charts for viewing the HMTL locally.

  • https://download.videoray.com/charts for viewing the HMTL online.

  • https://download.videoray.com/documentation/charts/pdf/videoray_doc_charts.pdf for viewing the PDF online.

  • https://download.videoray.com/documentation/charts/zip/videoray_doc_charts.exe for downloading the HTML and PDF files.

Document Conventions

Several symbols are used throughout this documentation to add emphasis and to assist in relocating important information. The following table describes these symbols and their uses.

SYMBOL DESCRIPTION
The Danger icon is used to indicate there is a potential risk of personal injury or death. Extra care should be taken to understand the risks, and all personnel should exercise caution. It may also be appropriate to warn others in the immediate vicinity.
The Caution icon is used to indicate there is a potential risk of damage to the equipment or surrounding property. Personnel should receive training in the appropriate procedures before attempting to operate or maintain the equipment.
The Do Not icon is used to indicate that an action or activity should NOT be performed.
The Note icon is used to highlight a specific detail or point of information.
The Tip icon is used to highlight a suggestion or recommendation.

Beyond this Document

There is no substitute for experience and/or training, especially with respect to the real purpose for which you plan to use this equipment. We encourage you to explore options beyond the scope of these materials to expand your knowledge and skills necessary to support your applications. In addition to this documentation, VideoRay offers training and technical support and hosts a general user discussion forum and user image gallery.

We also realize that collectively, users of our products spend considerably more time operating our systems than we do ourselves. Users also encounter more diverse operating environments across an extremely broad range of applications. We highly value this vast experience base, and invite and encourage you to share your experiences and suggestions with us. Please feel free to contact us by any of the methods listed below.

Quality Commitment

VideoRay strives to design, manufacture, deliver and support the highest quality products and services, including this documentation. We have made every effort to ensure that this documentation is accurate and provides you with the most up-to-date information.

If you find any errors in this documentation or have suggestions for improvements, each page contains a "Help us improve this document" feedback link in the left margin (you must be connected to the Internet to use this link).

Address  
VideoRay LLC
212 East High Street
Pottstown, PA 19464
USA
 
 
Email  
info@videoray.com General Information and Sales
support@videoray.com
 
Technical Support
Telephone  
+1 610-458-3000 Office
+1 610-458-3010 Fax

Disclaimer

This document is deemed accurate at the time of its writing, however it is not a legal contract and the information contained herein should not be construed to represent any form of commitment. This document as well as the associated products and services are subject to change without notice.

Creating and Using Charts

How to Guide, 1.00.01

Section 4

How to Get Help

Help for your Creating and Using Charts
is available through several channels.

All Hours Self-Service / Crowd-Source Tools

Operator's Manuals and Standard Operating Procedureswww.videoray.com/support/manuals.html
Software Downloadswww.videoray.com/support/downloads.html
Frequently Asked Questionswww.rovfaq.com
ROV User Forumwww.rovinfo.com

Global Support

Emailsupport@videoray.com
Phone+1 610-458-3000 (select option 1)
Additional messaging services are available.Contact us using one of the above methods for options supported.
Remote Sessionswww.videoray.com/support/remote-support.html (by appointment )

Regional Support

VideoRay Authorized Dealers and Service Centershttps://videoray.com/contact-us/locate-dealer-or-service-center/

Training

Emailtraining@videoray.com
Phone+1 610-458-3000 (select option 1)
Training OpportunitiesTraining Overview

Operational Strategies and Tactics Support

If you need help understanding how to apply your system to a specific project, contact VideoRay or you local VideoRay dealer. We can provide guidance or help you find a certified consultant.

Section 5

Before Contacting Support

Please make sure to consider the following information before contacting VideoRay's Technical Support to report a problem. The following information should available:

  • User name and contact information
  • Name of the owner if not the same as the user
  • System model
  • Serial Number of the affected component(s)
  • Accessories in use
  • Detailed information about the issue:
    • Symptoms
    • Operating conditions that create the symptoms
    • Anything new or unusually about the system or operations

Once you have collected the recommended information, visit the "How to Get Help" page for contact information.

In addition, please review VideoRay's Support website for additional information about:

  • Principles of Customer Interactions
  • Customer Care Philosophy
  • Technical Support Policy
  • Third Party Accessory Support Statement
  • Use of Non-VideoRay Supplied Computers
Creating and Using Charts

How to Guide, 1.00.01

Section 6

Overview

VideoRay control software and other related applications can use charts to aid in mission planning and navigation. These applications require a geo-referenced file that includes coordinates and scaling information. This document provides information on how to create and use these geo-referenced charts.

Creating and Using Charts

How to Guide, 1.00.01

Section 7

Creating Charts

Several tools are available for creating charts. This document is not intended to be comprehensive list of all possible options.
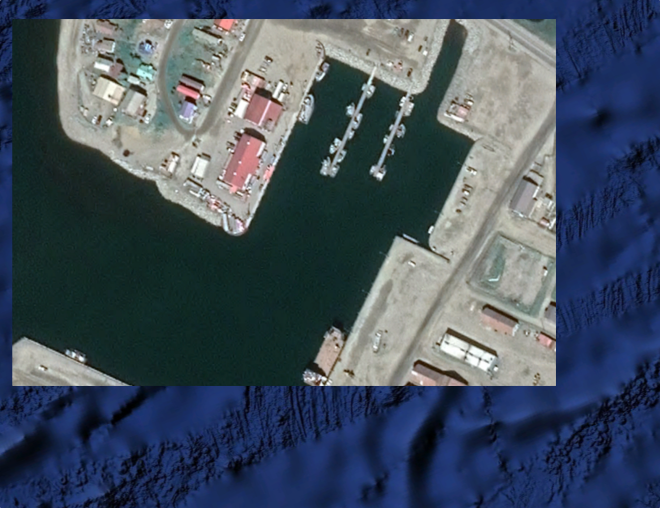
  • GE2KAP (free, but no longer supported - upgrade to SAT2CHART)

  • SAT2CHART (free)

  • Global Mapper (available for purchase)

For most users, the free versions will be sufficient for their applications. For those requiring increased accuracy and higher image resolution, the programs available for purchase may be more suitable for specific applications. It is recommended that you try the free version first and decide whether these meet your needs. If not, you can explore the other options. Some of the programs available for purchase include a free evaluation period.

Section 8

Using SAT2CHART to Create Charts

SAT2CHART works in conjunction with Google Earth, SAS.Planet or OpenCPN to create charts in various formats, including KAP. These charts can be used is various software applications that have mapping and geo-referencing features.

SAT2CHART, Google Earth, SAS.Planet and OpenCPN are comprehensive programs with features well beyond the scope of this How to Guide for creating charts for underwater navigation. There are many online tutorials for using these programs from novice through expert levels. The instructions provided here are just the "tip of the iceberg," but will satisfy the majority of the requirements for typical ROV applications. If you want more information or need additional technical advice please see the available online offerings.

SAT2CHART is a Microsoft Windows based program. It will require a separate Windows computer for Mission Specialist systems that use Ubuntu. Charts can be made in the office, and the Windows computer will not necessarily be needed in the field.

Quick Summary

  1. Download the SAT2CHART software.
  2. Install SAT2CHART.
  3. SAT2CHART requires additional software, including oorexx (Open Object Rexx) and GDAL. The links for these can be found in the SAT2CHART help file, which is installed when you install SAT2CHART. SAT2CHART will not start unless these prerequisites have been installed.
  4. After the installation of SAT2CHART is complete follow the installation/configuration procedures found in the Readme.html file found in the installation directory, typically: C:/SAT2CHART/SAT2CHART.Vxx.x.x.x/Readme.html, where the "x"s represent the version number.
  5. Navigate from the readme.html file to the Installation section and follow the instructions in the Prerequisites sub-section to install oorexx and GDAL.
  6. Download and install oorexx and GDAL.
  7. After the prerequisites have been installed, SAT2CHART can be started and you can access the Help file using the Help button.
  8. Start SAT2CHART.
  9. Start your desired mapping platform - Google Earth or SAS.Planet.
    • Both Google Earth and SAS.Planet need to be configured to work with SAT2Chart. See the Help file for information on the configuration requirements. After configuring the software, you should close and restart it.
  10. Use Google Earth or SAS.Planet to view the desired area for your chart.
  11. In the lower left of SAT2CHART, in the "Create Chart(s) From:" section of the window, select Google Earth or SAS.Planet.
    1. If using Google Earth, you will need to select the Google Earth option.
    2. If using SAS.Planet, you will need to select the SAS.Planet option.
  12. In SAT2CHART, enter a folder and file name for your chart in The "Chart Location\Name:" field.
  13. Click on the Create Chart button in SAT2CHART.
  14. When complete, click on the View Chart button to confirm the chart has the desired area.
  15. Close SAT2CHART and Google Earth or SAS.Planet.
  16. Load your chart in the ROV control software.
  17. Use your chart.

Reference Information

The instructions below are the basic version. If you need further help, see the SAT2CHART Readme.html file referenced above.

Downloads

SAT2CHART, Google Earth and SAS.Planet can be downloaded using the following links:

The above links are managed by their respective providers. We do our best to keep these links up-to-date, but if they do work use your favorite search site to find and download the requirements. If you have difficulty, contact support@videoray.com.

Installation

Once your files selections have been downloaded, execute each program in the order listed above to complete the installation. Select the default prompts during the installations.

Follow the instructions in the Readme.html file for configuring Google Earth to satisfy SAT2CHART's requirements. In general, you can ignore the configuration items indicated as optional.

Operation

If you are going to be making charts on a regular basis, you should create a base folder called "charts" or something similar. You can create project folders within your charts folder to help keep your charts organized.

Creating Charts Using Google Earth

  1. Launch SAT2CHART from the Windows Start Menu.
    If this is your first time using SAT2CHART, viewing the tutorial is highly recommended.
  2. If you want to use Google Earth, select the Google Earth option from the "Create Chart(s) From:" in the lower left section of the window.
  3. Start Google Earth and navigate to the desired area for the chart you intend to create.
    Zoom in as far as possible while still keeping the perimeter of the area in your view to get the best resolution for your chart.
    The Readme.html file has additional criteria / requirements for selecting the area of your chart. You must adhere to these requirements.
  4. Return to SAT2CHART (Alt-Tab).
  5. Enter a folder name and file name for the chart to be created in the "Chart Location\Name:" field. The folder must exist, but the chart file name does not need to exist. If the chart file name exists, you will be asked whether to overwrite it or not.
  6. Click on the Create Chart button.
  7. When the chart is created,, you can preview it by clicking on the View Chart button.
  8. The chart will be created as a .KAP file in the folder you specified.
  9. Close SAT2CHART and Google Earth.

Creating Charts Using SAS.Planet

  1. Launch Sat2Chat from the Windows Start Menu.
  2. If you want to use SASP.Planet, select the SAS.Planet option from the "Create Chart(s) From:" in the lower left section of the window.
  3. Launch SAS.Planet by navigating to the folder where you installed it and double click on .
  4. After SAS.Planet starts, navigate to the desired area for the chart you intend to create.
    Zoom in as far as possible while still keeping the perimeter of the area in your view to get the best resolution for your chart.
  5. Return to SAT2CHART (Alt-Tab).
  6. Enter a folder name and file name for the chart to be created in the "Chart Location\Name:" field. The folder must exist, but the chart file name does not need to exist. If the chart file name exists, you will be asked whether to overwrite it or not.
  7. Click on the Create Chart button.
  8. When the chart is created,, you can preview it by clicking on the View Chart button.
  9. The chart will be created as a .KAP file in the folder you specified.
  10. Close SAT2CHART and SAS.Planet.

Your chart can be found in the folder and with the name you specified. This file can be copied to and loaded in your application. See Using Charts.

Creating and Using Charts

How to Guide, 1.00.01

Section 9

Other Sources of Charts

Creating and Using Charts

How to Guide, 1.00.01

Section 10

Using Charts

This section includes information on how to use charts in the following applications.

Section 11

Using Charts in Greensea

After creating your chart, copy it to the desired folder on the Operator Control Console.

If you are going to be making charts on a regular basis, you should create a base folder called "charts" or something similar. You can create project folders within your charts folder to help keep your charts organized.

Procedures

  1. Start the Greensea software.
  2. Make sure the Map view is available (using F1 or F4).
  3. Select the Map Config tab from the tabs under the map area.
  4. Select the Charts sub-tab on the left.
  5. Use one of the following methods to load the chart.
    • Method 1
      1. Click on the "Import File (or drag and drop file onto map)" button.
      2. Browse to the desired file location.
      3. Select the desired file and click the Open button.
    • Method 2
      1. Open a File Explorer window.
      2. Navigate to find your chart file.
      3. Drag and drop the chart file from the File Explorer window onto the map area.
  6. The map area will automatically zoom to the newly loaded chart.

You can load more than one chart, such as aerial and bathymetric views of the same area. You can also change the opacity of each chart. Reducing the opacity can help with sonar image analysis and interpretation.