Operating the Blueprint Subsea |
Blueprint Subsea Oculus Sonar |
The Blueprint Subsea Oculus M series multibeam sonar is perfectly suited to complement the VideoRay Mission Specialist Defender. It is small, lightweight and provides excellent image quality. The Oculus is dual frequency enabling it to support a broader range of mission applications. The sonar can be used for navigation, inspections, searches and other more specialized applications. In this lesson, we will explore the features of the Oculus sonar, a brief discussion of sonar image interpretation, and the settings and adjustments to achieve the best results while using it. |
Operating the Blueprint Subsea |
Simple Scene |
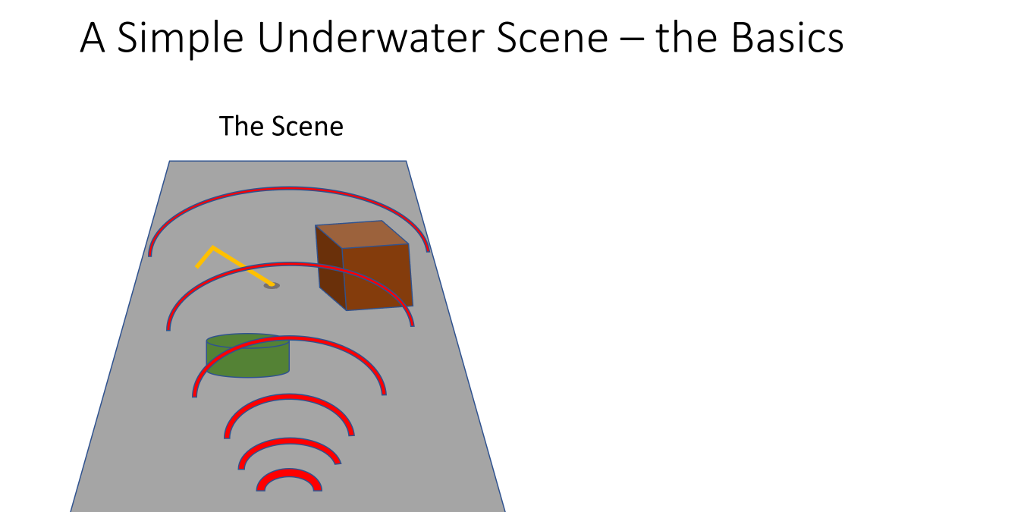
Before we discuss the specifics of the BlueView Subsea Oculus sonar, let's take a brief look at how multibeam sonar images are created, to help understand how we can get the best images using the tools available. If you are familiar with sonar image interpretation, you can skip this page and the next. Here we see a simple underwater scene with a short cylinder, a taller cube behind it and something that looks like a pipe coming out of the ground from its lower right and then bending down to the left. We will assume the sonar is at the bottom of the image and slightly higher above the bottom than the cube is tall. The image creation process begins with an acoustic pulse from the sonar head. As a multibeam sonar, the Oculus actually emits 512 focused beams simultaneously, so the pulse is really an array of many pulses. As the pulse proceeds outwards, the beams attenuate, losing energy, as represented in this image by the thinning bands. Also, at some point, parts of the pulse encounter our objects. When they encounter an object, they are reflected in various directions. The sonar switches to listening mode in order to process these reflections into an image. |
Operating the Blueprint Subsea |
Simplified Image Interpretation |
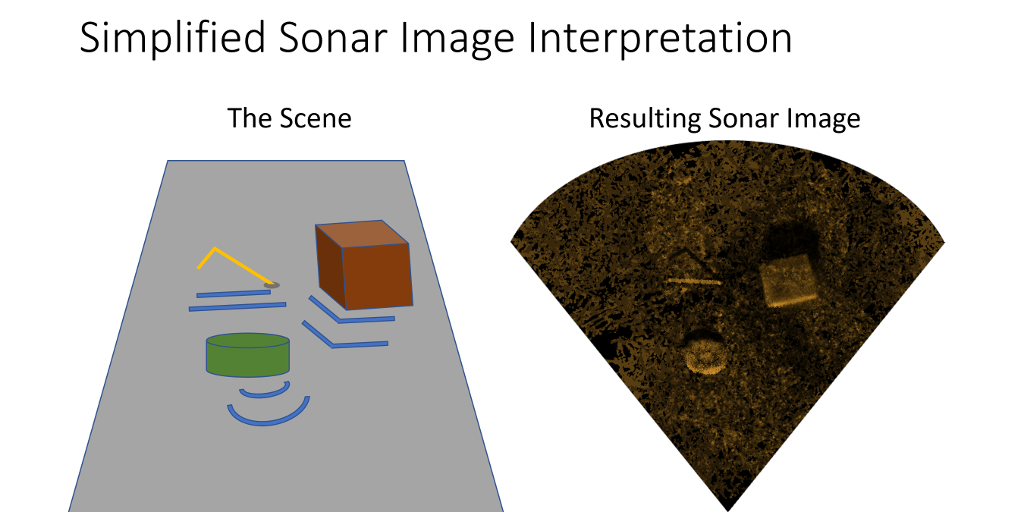
As seen on the left in this image, some of the reflections, or echoes, are returned in the direction of the sonar. The sonar interprets two important characteristics of these echoes, the amplitude and the time it is received, relative to the initial array pulse. Using this information, the sonar generates an image by plotting the radial location based on the speed of sound and the round trip time, and the angular location based on which beam receives the reflection. The amplitude is converted into a color and plotted at that point. Generally, the larger the amplitude the brighter the color. What results is a top down view of the scene as seen on the right. Some things to note about the sonar image on the right. First, the edges facing the sonar usually return the loudest echoes and are rendered with the brightest colors. The second is that areas behind the object are in acoustic "shadows" and the sonar receives no information about these areas. These acoustic shadows are displayed as dark areas on the distant side of each object. If there was treasure chest behind the cube, we would not be able to tell from this direction. As noted earlier, the sonar is higher than the cube is tall, so the shadows are not that long and we can see more details beyond them. Eventually however, the pulse attenuates to a point such that the sonar can no longer receive echo data, limiting the sonar to a fixed maximum range. While the bright spots tell us an object is present and where it is, the shadows often give us as much or more information about the details. The pipe is a good example of this. If you look at the bright spot representing the pipe on the sonar image, you can see it is a straight line which conveys no information that it is bent or sticking up. This is because the plane of the bend is perpendicular to the location of the sonar and from that angle, every part of the pipe is roughly the same distance from the sonar, and the result is a straight line. But, if you look at the shadow of the pipe, you can clearly see it is bent and that the pipe is angled up from the bottom. The lesson here is that sonar image interpretation relies on understanding both the light and dark regions to make the most sense of the image. This has been a very brief introduction, but we will return to a few more image interpretation exercises at the end of this lesson. |
Operating the Blueprint Subsea |
Frequency Selection |
Returning to explore the details of the Oculus Sonar, the M750d and M1200d offered by VideoRay are both Dual Frequency sonars. Only one frequency is active at a time and the control software interface allows you to select which frequency to use. This information will help you make that selection. Navigation mode uses the sonars' lower frequency (750 kHz and 1.2 MHZ respectively for each model) and is characterized by a longer range due to less attenuation, lower resolution based on the lower frequency and a wider field of view due to the individual beams having larger angular spread and therefore requiring more angular separation between each beam. Identification mode uses higher frequencies (1.2 kHz and 2.1 MHz respectively) and is characterized by a shorter range due to more attenuation, but a higher resolution. The field of view is narrower because the angular spread of each beam is less and the beams require less separation. The modes are aptly named. When searching for objects or for general navigation, Navigation mode is preferred. Once a target it observed, switching to Identification mode will provide more details to help identify what the object is as long as you can get close enough to be in range. |
Operating the Blueprint Subsea |
Range Slider |
Let's look at some real numbers for the Oculus M750d sonar. At low frequency (750 kHz), the maximum visible range is adjustable from 0.1 m to 120 m (or 0.3 ft to 400 ft). The field of view is 130 degrees horizontally and 20 degrees vertically (10 degrees up and down from the centerline). The beam information is provided here for reference, but it is not adjustable. At high frequency (1.2 MHz), the maximum visible range is adjustable from 0.1 m to 40 m (or 0.3 ft to 130 ft). The field of view is 70 degrees horizontally and 12 degrees vertically (6 degrees up and down from the centerline). Again, the beam information is provided here, but it is not adjustable. The maximum visible range in either mode can be adjusted by using the Range slider or the (+) - (-) buttons on the Sonar tab. The current Range value is displayed above the slider and annotated range rings will be present on the sonar image. If the Cam / Sonar tabs are not visible. press the F6 key on the keyboard to unhide them. |
Operating the Blueprint Subsea |
Gain Slider |
The sonar gain is a measure of the amplitude of the output signal. The gain is adjustable. The gain should be increased when working at longer ranges in either mode, and decreased when working at shorter ranges. If the gain is too high, it can wash out the image, especially at close ranges. The gain can be adjusted by using the Gain slider or the (+) - (-) buttons on the Sonar tab. The current Gain value is displayed above the slider. |
Operating the Blueprint Subsea |
Color Mapping |
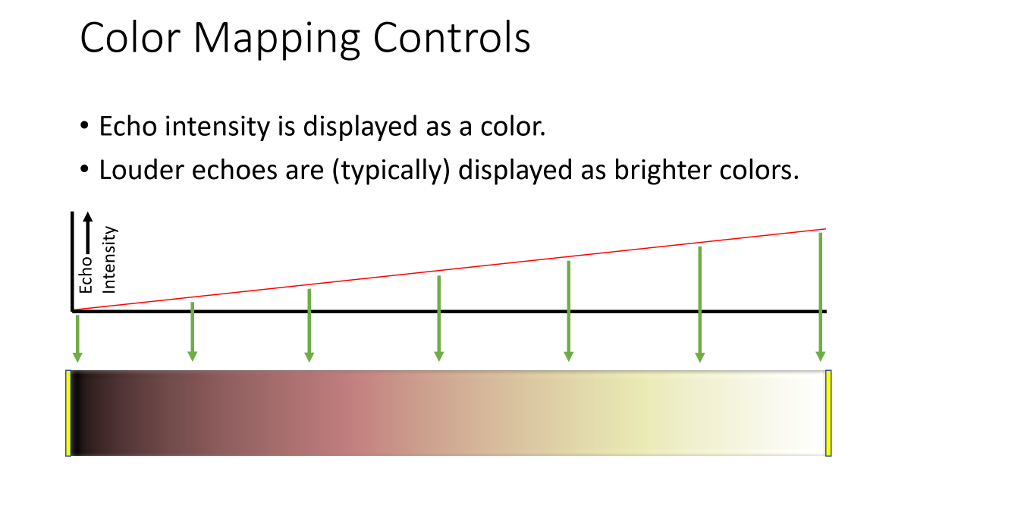
This image shows how the different intensities of the echoes are converted to a color. In general, the greater the intensity, the brighter the color, but you will see shortly that is not always the case. |
Operating the Blueprint Subsea |
Color Palette Selection |
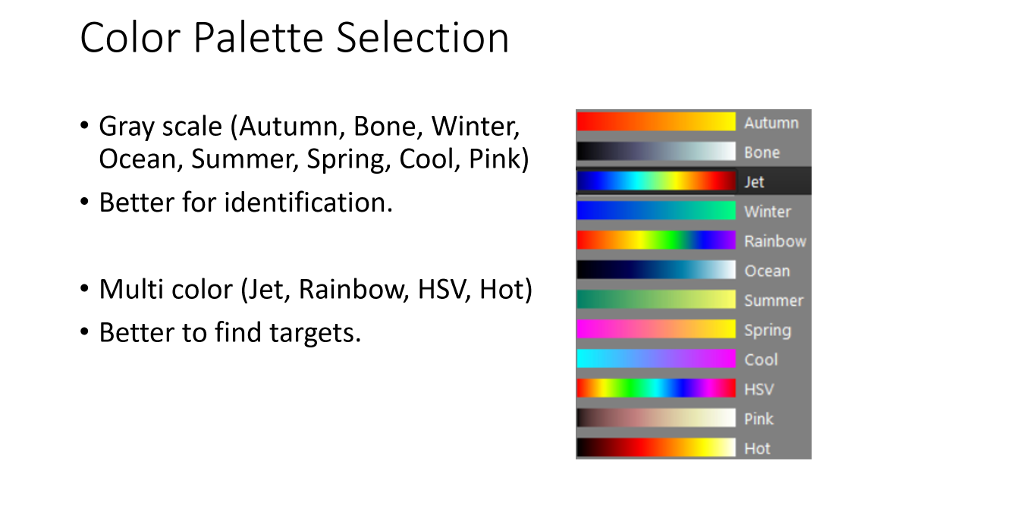
The software allows the user to select different color mapping palettes. The selection is based on personal preference, but there are some guidelines depending on your objectives. You will see there are two basic categories of color palettes. Gray scale, or fading from one color to another, and multi-color. Both of these are identified and categorized here. The gray scale palettes are usually better for visualizing features or identifying what a target is. This is because the bright areas and shadows create an almost 3D looking image of the targets. The multi-color palettes are good for finding "hot spots" or making targets stand out from the background to assist with searching for targets. Seeing a bright red spot in a field of blue is easier than spotting a tan spot in a field of brown to light beige. While learning how to interpret sonar images, you should experiment with different color palettes when viewing the same scene to see what details you can see (or not) with each palette and decide whether one palette is better than another in a given situation. You can do this during playback of recorded sessions so you can do a virtual side by side comparison. |
Operating the Blueprint Subsea |
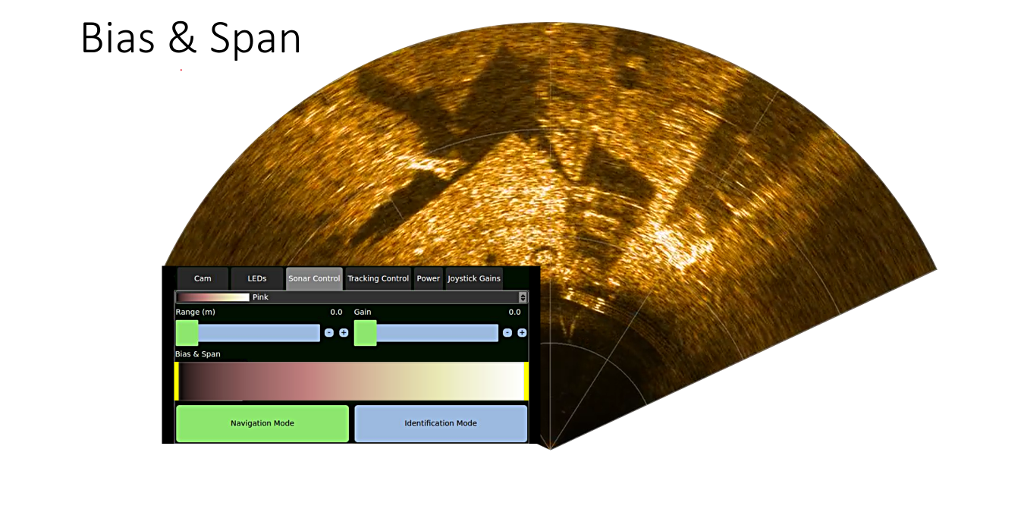
Bias & Span |
The Bias and Span are additional image quality parameters, that can be varied to improve image quality and help with better analysis and interpretation. The Bias and Span is represented on the Sonar tab as an enlarged color palette with yellow bar sliders at each end. The sliders can be adjusted to change the intensity to color mapping and change the look of the image. |
Operating the Blueprint Subsea |
Span Threshold |
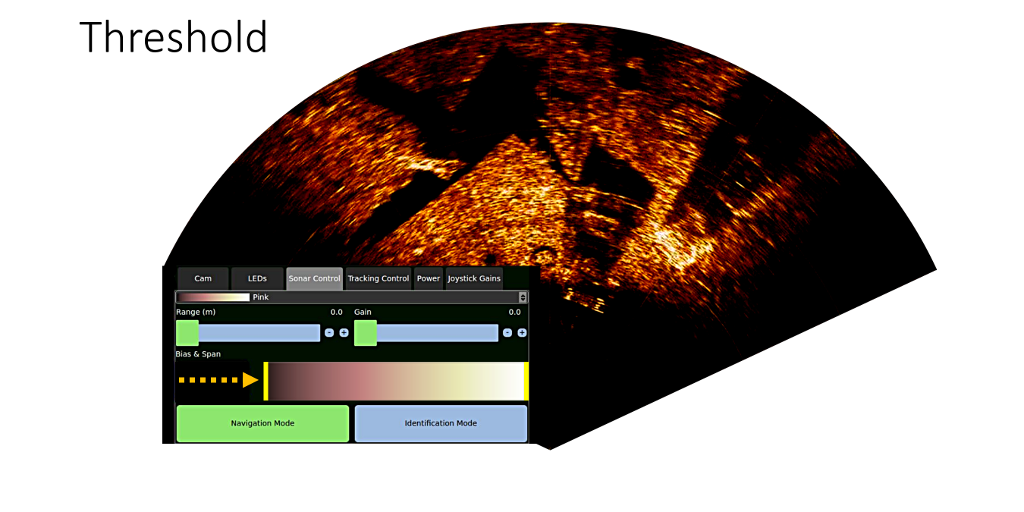
Let's take a closer look at the Span first. If the left slider is moved to the right, we are essentially creating a cut-off threshold. Any echo intensities below this threshold are displayed in black (in other words, no longer presented in the image). As you can see from this image, we have increased the threshold so much that we are starting to reduce the overall quality of the image and losing almost all of the low-level details. The primary application of adjusting the left side of the Span is to remove background noise. This can be done by moving the slider to the right until you begin to lose some of the details. At this point, slide the slider back, just a little, to the left. Any signals below this point are primarily background noise and this noise is now filtered out to improve the image. |
Operating the Blueprint Subsea |
Span Intensity |
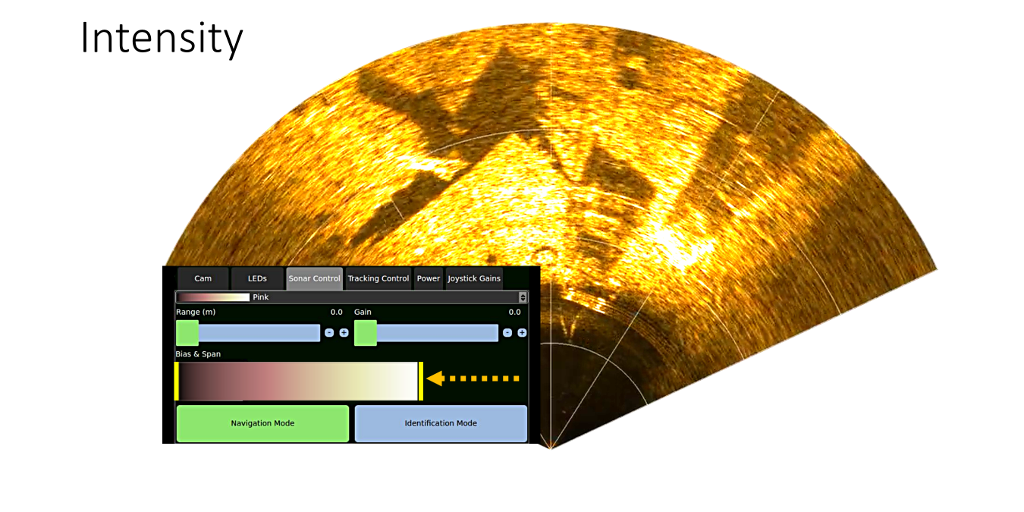
The right side of the slider can be moved to the left to reduce the span from that end. This effectively makes the entire image brighter as you can see in this example.<>/p> Again, this example exaggerates the effect so that is it more obvious. You can see that the bright targets are almost completely washed out. As opposed to a cut-off threshold, this action results in increasing the overall image intensity. This can help when looking for dim targets at long ranges. In those situations, you should first attempt to increase the gain. The reason is that when you decrease the span from either end, you are reducing the number of shades of color available to be mapped and this will reduce the fine details of the image as the similar intensities will be rendered with the same colors. When the span is set to its full range, the color mapping presents the best color separation for slightly different intensities. |
Operating the Blueprint Subsea |
Bias |
By adjusting the Span from each end, you can introduce Bias. The Bias represents a favoring of either lower intensity signals or higher intensity signals in the display. This feature is seldom used in practice, but you should experiment with it to determine if there are any situations where it can improve the results of your data. While these descriptions highlight the various functions, the best way of learning is to use an image to experiment with the different settings. There is no “correct setting” as every operator’s eyes and preferences will be different, learn what works for you and use that as your start point when tuning your sonar picture. |
Operating the Blueprint Subsea |
Recording Sonar |
The sonar images can be recorded when the Record icon button on the control bar is clicked or the Record button on the hand controller is pressed. The file name will be in the format: timestamp_sonar.mp4 and files are saved in home/ggs_logs/. The files can be shared and viewed using almost any media player software. Still image screenshots can also be saved. Using one of the views that includes sonar (F1, F3, or F5,) the sonar image will be captured when clicking on the Camera icon button on the Control Bar or by pressing the snapshot button on the hand controller. These images will be stored as .png files, in home/gss_logs. Now let’s move on to some more advanced interpretation of the sonar imagery. |
Operating the Blueprint Subsea |
Target Quality Factors |
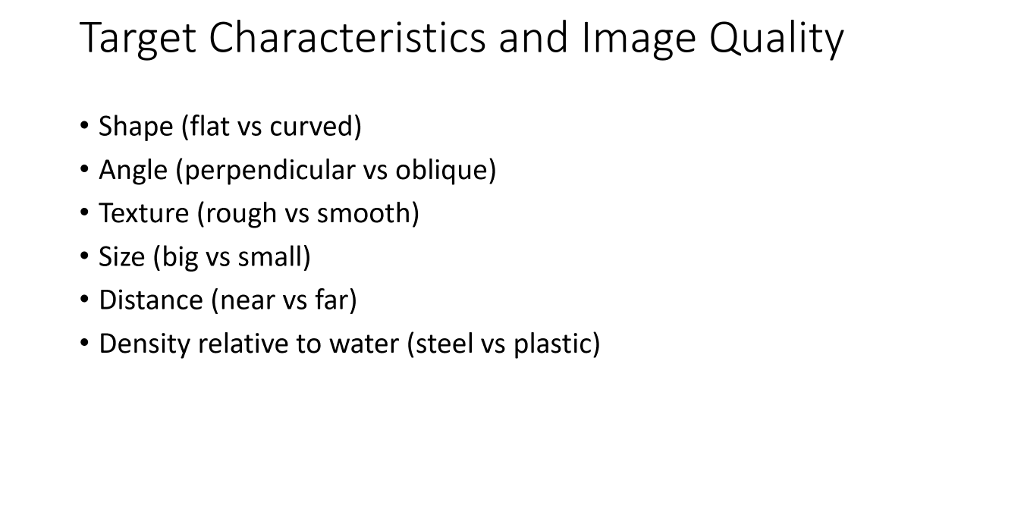
The Mode, Color Palette, Range, Gain, Bias and Span represent the first level of options for adjusting the sonar image quality. We will look at some advanced level settings at the end of this lesson. Before we do that, let's turn our attention for the moment to the physical characteristics that make a scene something that will display well or poorly. Unfortunately, you won't always be working in an area with low clutter and good targets. The following characteristics play an important role in determining what an object's sonar signature looks like. Some objects are just better than others and realizing this can help set expectations for what the best images, in any given situation, should look like. Note that the final result, is a combination of all of these, so considering one factor alone is not sufficient to decide something will make a good sonar target. Shape - Flat surfaces are generally better than curved ones. Angle – objects perpendicular to the sonar are generally better than those at oblique angles. If the angle is oblique enough, the reflection can be away from the sonar and an object the you might expect to see clearly, can actually look dark, like a shadow. Texture - Rough versus smooth can be interesting. Some rough surfaces can act like a multifaceted reflector and appear very bright. Smooth surfaces at the "right" angle can likewise be bright. This phenomenon is generally highly related to the other characteristics. Size - Bigger targets will generally appear better than smaller targets. If small enough, the sonar resolution might not be able to detect or display the object at all. Distance - The closer to the target, the less attenuation and thus, better the image. But, as mentioned, too much gain can wash out the details of a close target. Object Density relative to water - Reflections occur at the interface of an object and the water. Objects with similar densities, generally produce weaker echoes than objects that have markedly different densities. Another similar effect can be seen with hollow versus solid objects. An empty steel drum will produce a much better echo than a solid steel cylinder of the same size. |
Operating the Blueprint Subsea |
Sonar Pitch Angle Horizontal |
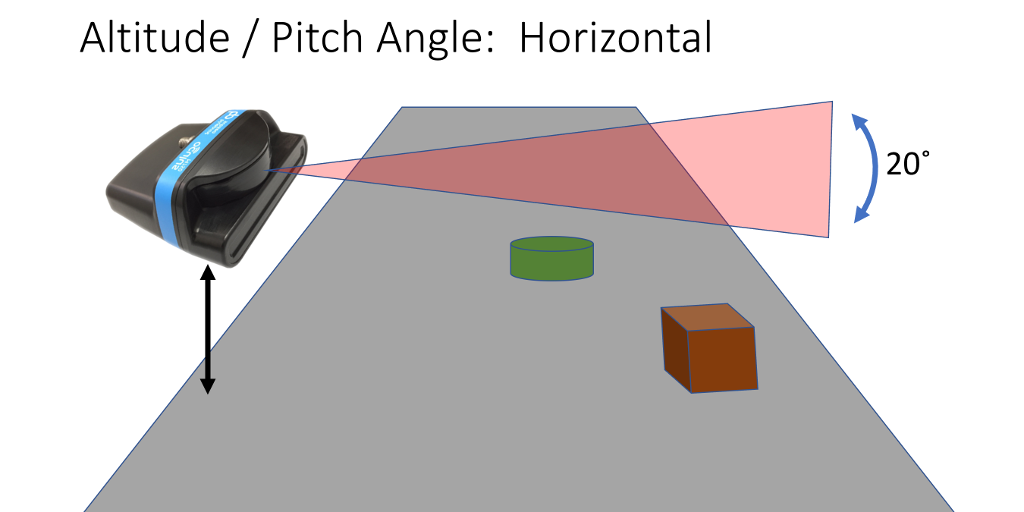
We have mentioned that the vertical angle of the M750d sonar covers 20 degrees at low frequency. If the altitude of the ROV is high off the bottom and the pitch angle of the vehicle is 0, it is possible that bottom targets may not be visible at all. Conversely if the pitch angle is too great, you will only see a thin strip of the bottom and could miss targets beyond that strip. |
Operating the Blueprint Subsea |
Sonar Pitch Angle Down 5° - 10° |
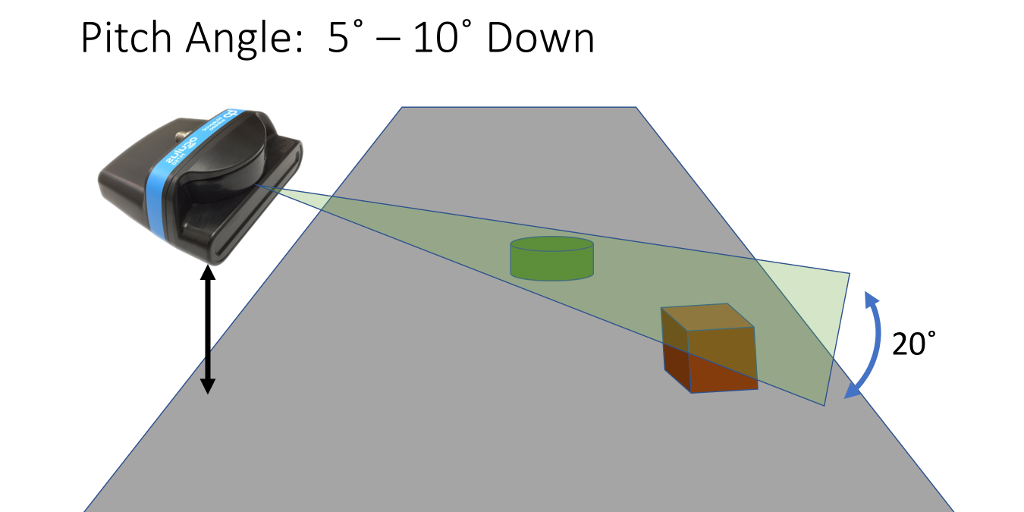
When navigating or searching for objects on the bottom, a slight downward pitch of 5 to 10 degrees is recommended. The altitude can be adjusted to focus on near or far targets. For searching, the altitude should be high enough to allow targets at the far end of the range to be visible. Once the target is found, the altitude can be decreased as the vehicle approaches the target. For ship's hull searches and inspections, the sonar should be angled up for the reasons just explained. The Defender's pitch control makes it an ideal platform to conduct sonar searches and inspections, because the pitch can be controlled in real time from the surface and the best coverage of the target area can be obtained. |
Operating the Blueprint Subsea |
Image Interpretation |
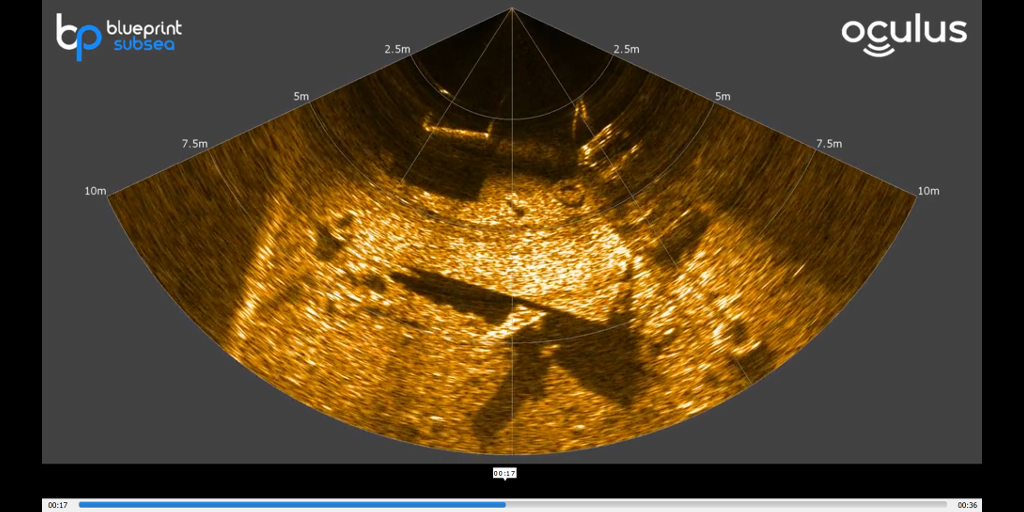
Let's do an image interpretation exercise using a sample real-world sonar recording. Watch this video and see how many things you can spot and then we will ask you questions about what you observed. Feel free to watch it multiple times or come back and watch it again if you don't spot a few of the things we mention. We will not cover 100% of everything visible in this sonar clip, but we will highlight some of the more interesting signatures of the objects. |
Operating the Blueprint Subsea |
Tires |
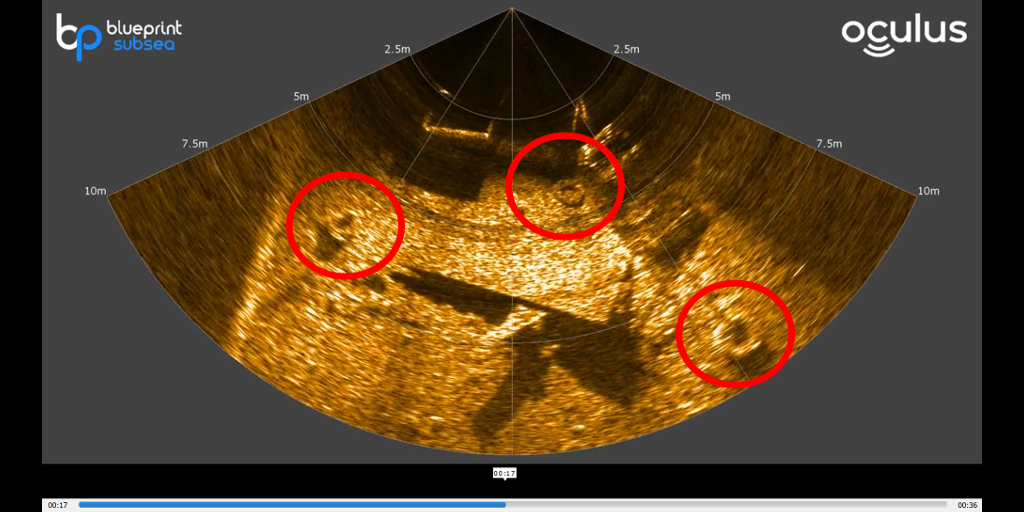
First, did you spot the three tires? Tires are a common feature of harbors and commercial waterways. Their donut like appearance makes them easy to recognize. |
Operating the Blueprint Subsea |
Flat Plate |
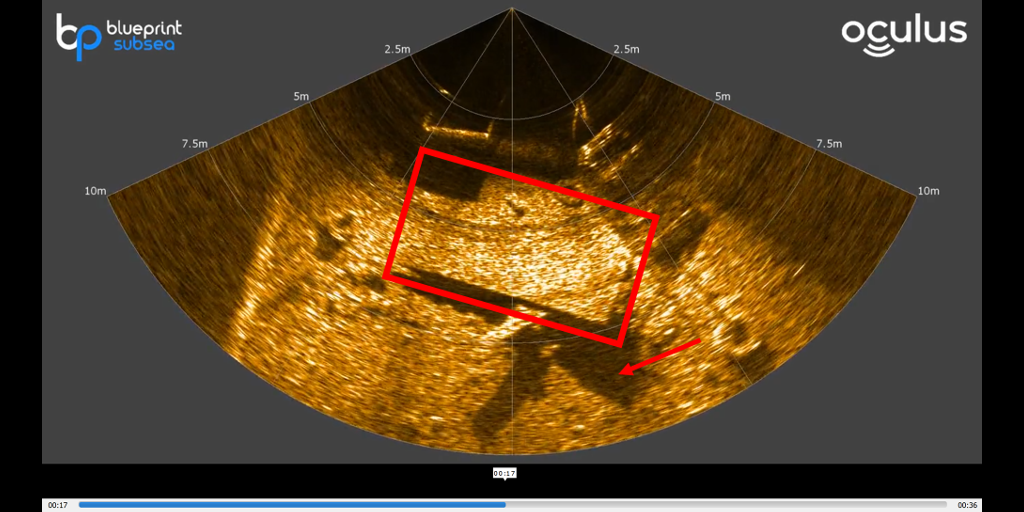
The large rectangular shape is some type of large flat plate. A few things to notice about it include:
|
Operating the Blueprint Subsea |
Tall Object |
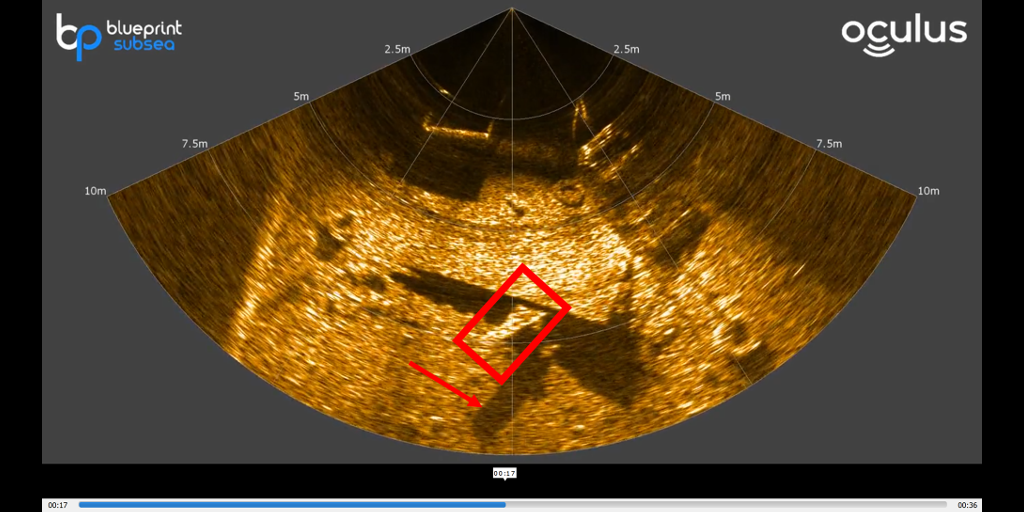
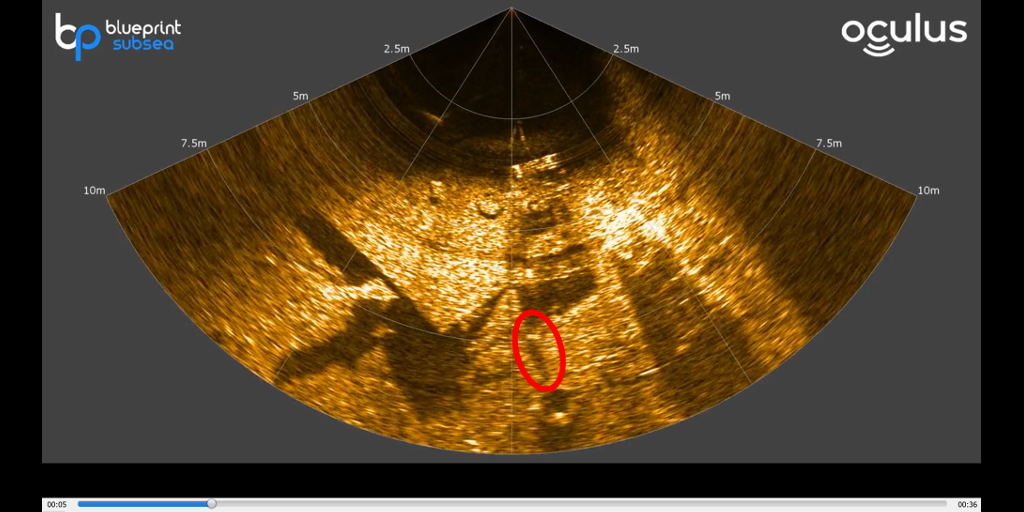
There is a tall object that is sticking out from under the far edge of the plate. This object appears to have a truss like structure. You can also tell that it is sticking up high by the separation of the top from its shadow indicated by the arrow. |
Operating the Blueprint Subsea |
Vehicle |
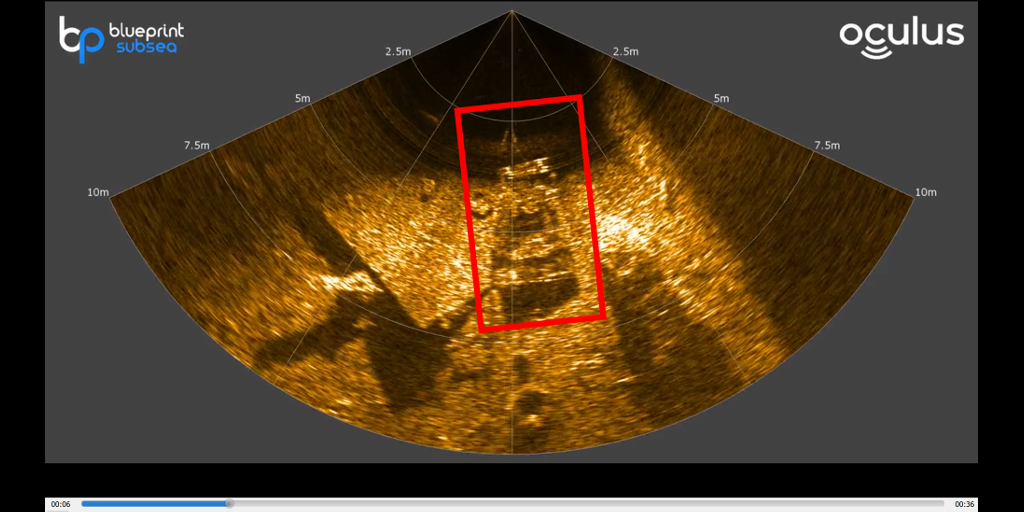
There appears to be some sort of vehicle in the front center of the scene. It looks more like a trailer of some kind than an automobile or small truck. Another distinct possibility is that it is a vehicle that is upside down. At the close end, there are two dotted lines. These look like cables or ropes. |
Operating the Blueprint Subsea |
Box, Hole, Mound |
Also closer to the sonar is a large square shaped box. More interestingly in this image you can see a hole and a mound. The hole is within the blue circle. There is no bright area on the front edge, but there is a definite shadow. This indicated the area within the shadow is lower than the front and the front is not raised above the surrounding gound - hence it must be a hole. The mound, or rock within the yellow circle, has the characteristic bright edge in front and a shadow behind. Given that the shadow is small, this is likely a small mound or rock. |
Operating the Blueprint Subsea |
Did You See the Fish? |
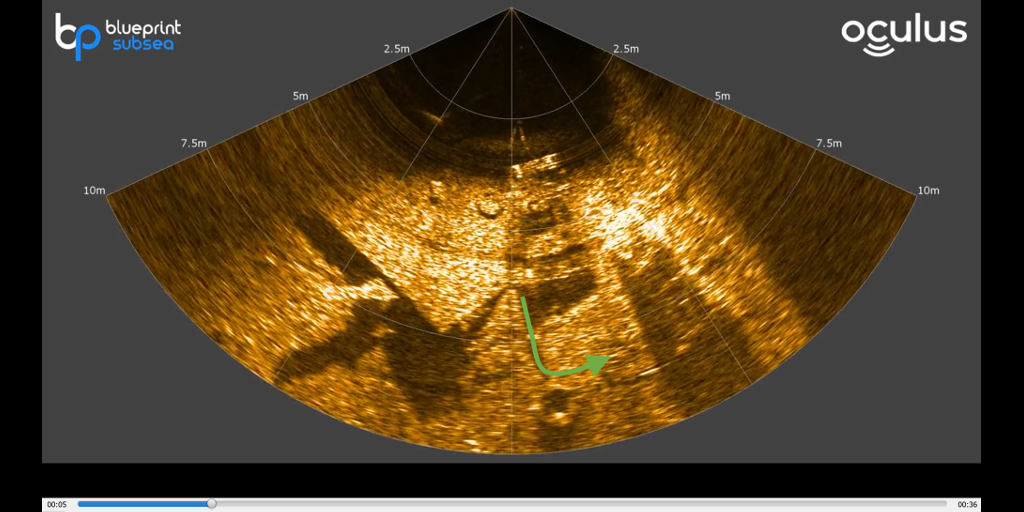
Did you spot the fish? It appears between 3 and 4 seconds into the clip from the far end of the vehicle and follows the path indicated here in green. |
Operating the Blueprint Subsea |
Fish |
Here at 5 seconds, you can see the fish and the shadow it is casting as it moves. If you didn't see it, you should go back and watch the video again. At about 17 seconds,you can see the fish move from the end of the path previously displayed toward the plate. It's path is right to left in this image, but from the sonar's perspective, the fish moves from left to right. |
Operating the Blueprint Subsea |
Measuring Objects Using Sonar |
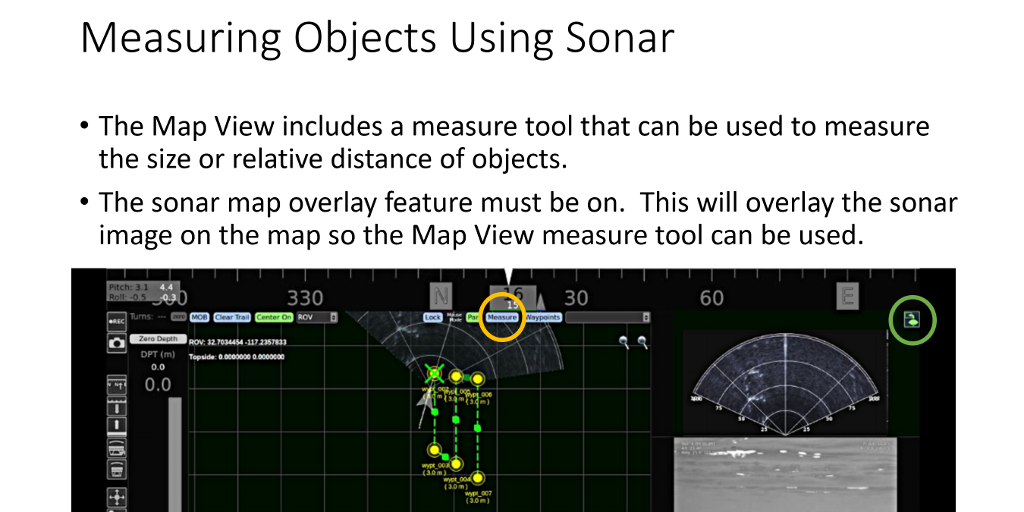
The sonar can be used to measure the size of objects and the relative distance of objects from the sonar or from each other. Measurements are taken on the Map view using the Measure tool. The sonar overlay must be turned on. This can be done, by clicking the Sonar Overlay button in the upper right of the Sonar view. When the button is green, the sonar overlay is on. This will superimpose the sonar image on the map. To make a measurement, click on the measure button at the top of the Map view. Then, position the mouse cursor over the point where you want to start your measurement, and click and hold the left mouse button. Drag the mouse cursor to the point where you want to measure to, and release the mouse button. The range (distance) and bearing from the first point, to the last will be displayed. |
Operating the Blueprint Subsea |
Advanced Settings |
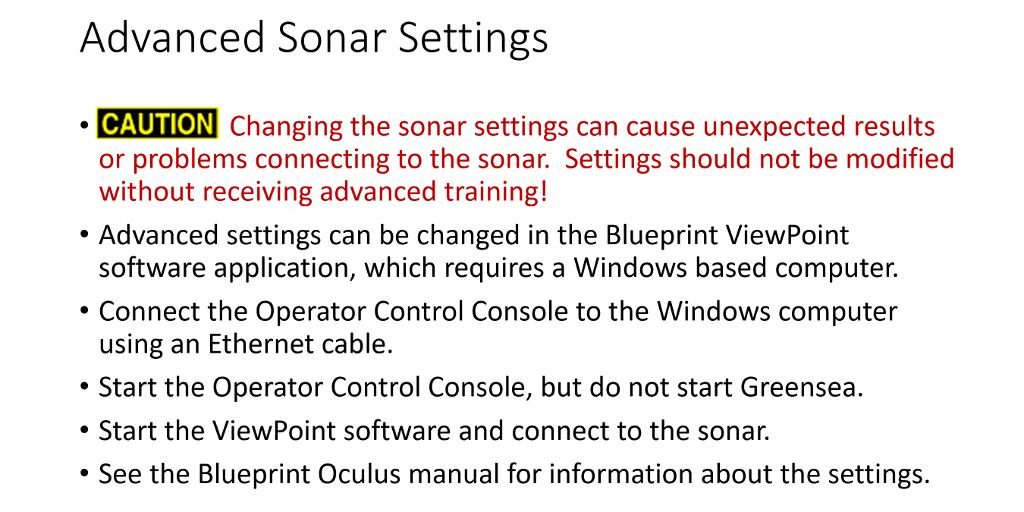
Finally let’s talk about changing the sonar’s settings, first a word of caution. Changing the sonar settings can cause unexpected results or problems connecting to the sonar. Settings should not be modified without receiving advanced training! Advanced settings can be changed in the Blueprint ViewPoint software application, which requires a Windows based computer. Connect the Operator Control Console to the Windows computer using an Ethernet cable. Start the Operator Control Console, but do not start Greensea. Start the ViewPoint software and connect to the sonar.See the Blueprint Oculus manual for information about the settings. |
Operating the Blueprint Subsea |
Summary |
In summary: Sonar image interpretation requires an understanding of how the image is created and how the vehicle control and sonar settings can be used to tune to a quality image. Sonar settings can be adjusted in the Camera / Sonar tabs under the sonar / video windows. If the tabs are not visible, press F6. The sonar will be recorded as a .mp4 video stream and stored in home/gss_logs. |